HOCR Analysis
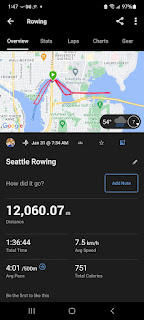
Below is a link to a chart showing my race tracks since 2022.
Hover-text on the chart includes details, such as distance raced, pace, etc.
Each track is broken into 125 m segments speed-color-coded:
- fast: top 25% of segments
- med fast: next 35%
- med slow: next 25%
- slow: last 15%


Comments
Post a Comment